四、新趋势 图表阅读 最后,点点还附上了一份关于不同年龄段的中国人周末喜好的调查数据,让Dylan更全面地了解中式周末生活。阅读材料,选择正确的答案。
We surveyed 300 people about what they like doing at weekends. There are 100 people aged 11—18,100 people aged 19—26 and 100 people aged 27—35. The people of 27—35 like watching films best. They watch films every weekend with their friends or relatives. The people of 19—26 like doing many things except taking a walk. The following chart shows their answers:
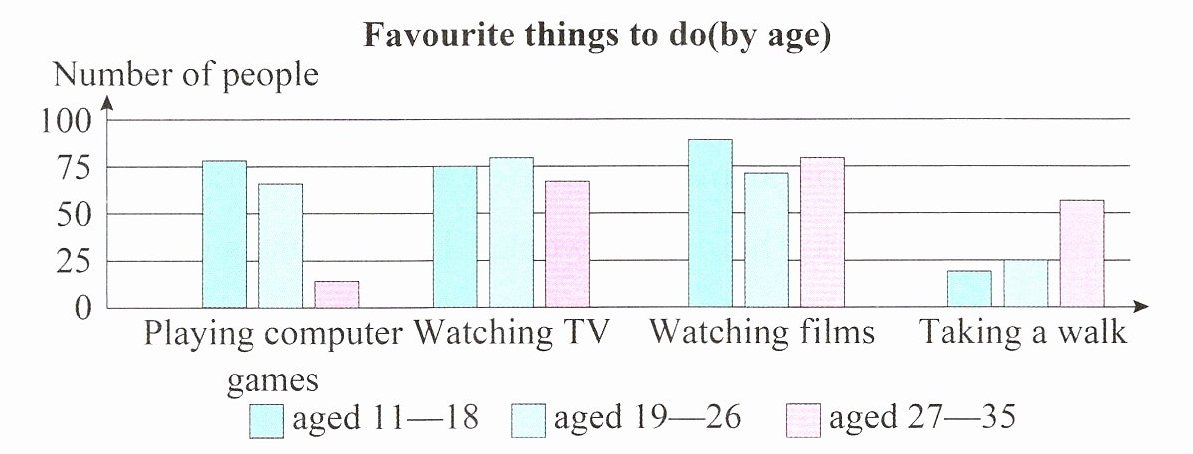
(
B
)1. What do the people of 19—26 enjoy doing most?
A. Taking a walk. B. Watching TV. C. Going to the cinema.
(
A
)2. Which group likes playing computer games most?
A. The people of 11—18. B. The people of 19—26. C. The people of 27—35.
(
B
)3. What do the people of 11—18 dislike doing?
A. Watching TV. B. Taking a walk. C. Going to the cinema.
(
C
)4. Which of the following is TRUE according to the chart?
A. 70 people like watching films in the 27—35 group.
B. All the people of 11—18 like playing computer games.
C. Fewest(最少的) people like taking a walk.
解析:
【分析】本题为英语图表阅读题,需先明确图表信息:图例显示浅蓝柱代表11-18岁、稍浅蓝柱代表19-26岁、粉柱代表27-35岁;横轴为周末活动,纵轴为人数,三个年龄段各100人。解题时需根据问题定位对应年龄段的活动柱子高度,分析数据得出答案。
【解析】1. 第1题:定位19-26岁对应的稍浅蓝柱,对比各活动柱子高度,看电视的柱子最高,故答案为B;2. 第2题:定位“玩电脑游戏”项的三个柱子,11-18岁的浅蓝柱最高,故答案为A;3. 第3题:定位11-18岁的浅蓝柱,对比各活动柱子高度,散步的柱子最低,说明该年龄段不喜欢散步,故答案为B;4. 第4题:A选项27-35岁看电影人数约80,不是70,错误;B选项11-18岁玩电脑游戏人数约75,不是全部,错误;C选项散步的人数(20、25、55)是所有活动中最少的,正确,故答案为C。
【答案】1.B 2.A 3.B 4.C
【知识点】图表阅读、英语阅读理解
【点评】本题结合柱状图考查英语阅读理解,需准确提取图表数据并对应问题分析,难度中等。
【难度系数】0.6